ABOUT :-
नब्बे के दशक की शुरुआत में राजरतन ने आयरन एंड स्टील ट्रेडिंग के पारंपरिक व्यवसाय से स्नातक की उपाधि प्राप्त की और टायरों के लिए बीड वायर के निर्माण में कदम रखा। भारत में ऑटोमोबाइल बूम निश्चित रूप से इस भविष्यवादी कदम के पीछे प्रमुख कारण था जो काफी चिंतन के बाद उठाया गया था। स्वदेशी प्रौद्योगिकी के साथ जो शुरुआत हुई वह जल्द ही कुशल कार्यबल द्वारा समर्थित एक विश्व स्तरीय विनिर्माण सेट-अप में उन्नत हो गई। वैश्विक स्तर पर ऑटोमोबाइल क्षेत्र के फलने-फूलने के साथ, राजरतन ने यह सुनिश्चित किया कि वे न केवल अपनी मौजूदा क्षमता का विस्तार करें बल्कि रणनीतिक भौगोलिक विस्तार भी सुनिश्चित करें। राजरतन थाईलैंड इसी प्रगतिशील सोच का परिणाम था।
गुणवत्ता, नवाचार और ग्राहक सेवा शुरू से ही राजरतन के अस्तित्व का आधार रही है। इसी दर्शन ने राजरतन को भारत में बीड वायर का अग्रणी निर्माता और आपूर्तिकर्ता और थाईलैंड में बीड वायर का एकमात्र निर्माता बनने में मदद की है। व्यापक समूह उत्पादन क्षमता के साथ कंपनी ने दुनिया भर में सबसे भरोसेमंद और पसंदीदा ब्रांड में से एक होने की प्रतिष्ठा अर्जित की है
- Market Cap₹ 3,140 Cr.
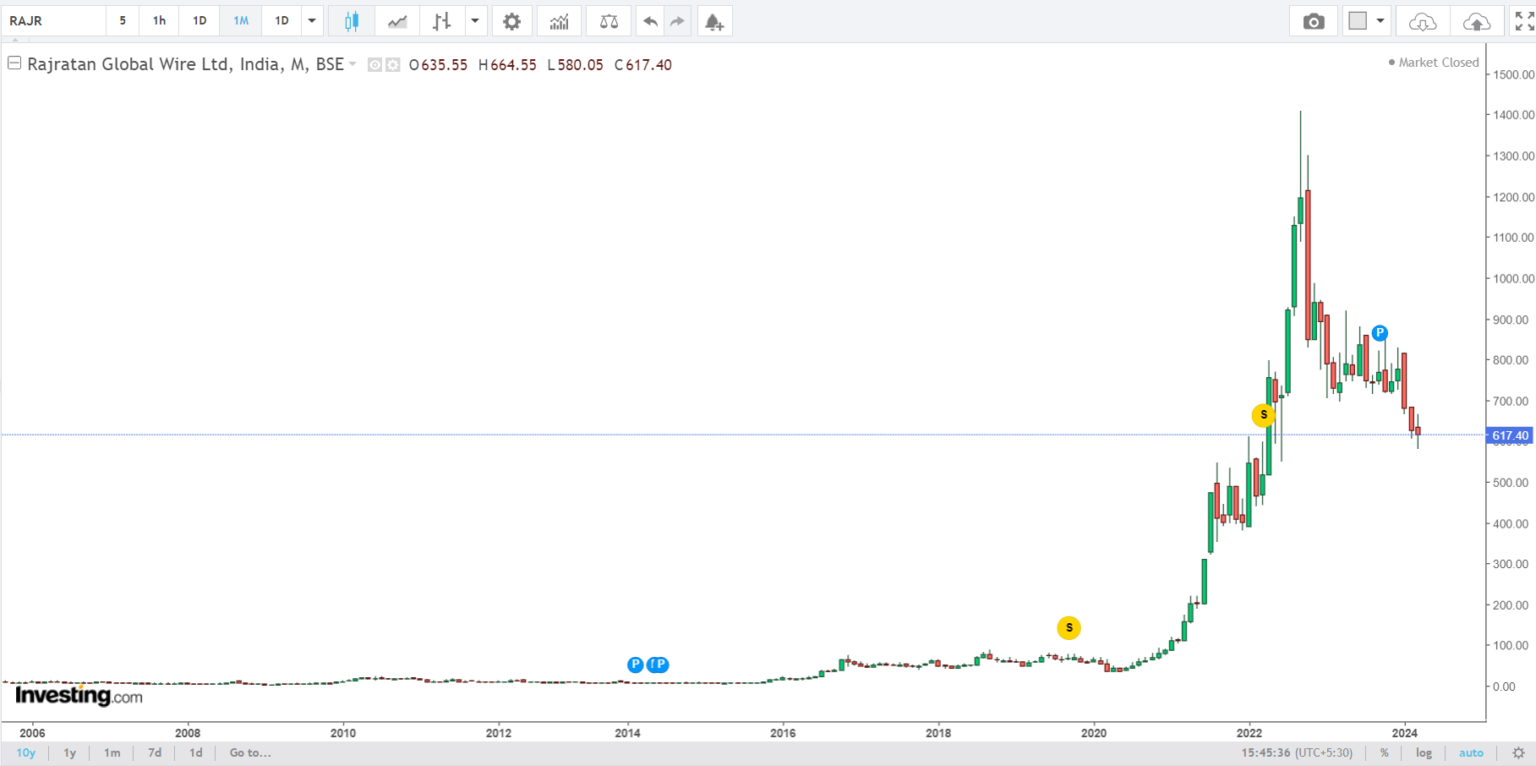
- Current Price₹ 618
- High / Low₹ 920 / 580
- Stock P/E 43.7
- Book Value₹ 89.0
- Dividend Yield 0.32 %
- ROCE 27.0 %
- ROE 25.7 %
- Face Value₹ 2.00
| Stock Price CAGR | |
|---|---|
| 10 Years: | 58% |
| 5 Years: | 62% |
| 3 Years: | 56% |
| 1 Year: | -21% |

Quarterly Results
Consolidated Figures in Rs. Crores / View Standalone
| Dec 2020 | Mar 2021 | Jun 2021 | Sep 2021 | Dec 2021 | Mar 2022 | Jun 2022 | Sep 2022 | Dec 2022 | Mar 2023 | Jun 2023 | Sep 2023 | Dec 2023 | |
|---|---|---|---|---|---|---|---|---|---|---|---|---|---|
| 159 | 184 | 182 | 241 | 222 | 248 | 251 | 225 | 200 | 219 | 204 | 214 | 233 | |
| 133 | 151 | 146 | 190 | 174 | 200 | 199 | 187 | 162 | 186 | 179 | 180 | 198 | |
| Operating Profit | 26 | 32 | 36 | 51 | 47 | 48 | 53 | 38 | 38 | 34 | 25 | 34 | 34 |
| OPM % | 16% | 18% | 20% | 21% | 21% | 19% | 21% | 17% | 19% | 15% | 12% | 16% | 15% |
| 1 | 1 | 0 | 1 | 1 | 1 | 1 | 2 | -1 | 1 | 1 | 1 | -0 | |
| Interest | 3 | 4 | 4 | 4 | 4 | 4 | 4 | 4 | 4 | 4 | 5 | 5 | 5 |
| Depreciation | 4 | 4 | 4 | 4 | 4 | 4 | 4 | 4 | 5 | 5 | 4 | 4 | 5 |
| Profit before tax | 20 | 26 | 29 | 44 | 40 | 40 | 46 | 31 | 28 | 26 | 17 | 26 | 24 |
| Tax % | 26% | 9% | 24% | 25% | 18% | 8% | 24% | 25% | 21% | 21% | 27% | 25% | 20% |
| 15 | 23 | 22 | 33 | 33 | 37 | 35 | 23 | 22 | 20 | 12 | 19 | 20 | |
| EPS in Rs | 2.90 | 4.57 | 4.31 | 6.42 | 6.45 | 7.29 | 6.80 | 4.59 | 4.33 | 3.99 | 2.45 | 3.84 | 3.88 |
Profit & Loss
Consolidated Figures in Rs. Crores / View Standalone
| Mar 2012 | Mar 2013 | Mar 2014 | Mar 2015 | Mar 2016 | Mar 2017 | Mar 2018 | Mar 2019 | Mar 2020 | Mar 2021 | Mar 2022 | Mar 2023 | TTM | |
|---|---|---|---|---|---|---|---|---|---|---|---|---|---|
| 252 | 252 | 283 | 274 | 283 | 283 | 345 | 493 | 480 | 547 | 893 | 895 | 870 | |
| 228 | 232 | 259 | 249 | 241 | 242 | 311 | 440 | 412 | 454 | 711 | 733 | 743 | |
| Operating Profit | 23 | 20 | 23 | 25 | 42 | 41 | 33 | 52 | 68 | 92 | 182 | 162 | 127 |
| OPM % | 9% | 8% | 8% | 9% | 15% | 14% | 10% | 11% | 14% | 17% | 20% | 18% | 15% |
| 1 | 2 | 1 | 1 | 1 | 2 | 7 | 2 | 1 | 2 | 2 | 3 | 3 | |
| Interest | 12 | 14 | 15 | 14 | 15 | 11 | 9 | 11 | 13 | 13 | 15 | 17 | 19 |
| Depreciation | 6 | 7 | 8 | 7 | 7 | 7 | 8 | 9 | 12 | 14 | 16 | 18 | 18 |
| Profit before tax | 6 | 1 | 1 | 5 | 21 | 25 | 23 | 34 | 44 | 66 | 153 | 130 | 93 |
| Tax % | 46% | 344% | 259% | 65% | 23% | 26% | 27% | 22% | 24% | 20% | 19% | 23% | |
| 3 | -2 | -2 | 2 | 16 | 19 | 17 | 27 | 33 | 53 | 124 | 100 | 72 | |
| EPS in Rs | 0.65 | -0.44 | -0.42 | 0.36 | 3.24 | 3.71 | 3.36 | 5.25 | 6.51 | 10.46 | 24.49 | 19.72 | 14.16 |
| Dividend Payout % | 16% | -19% | -20% | 24% | 3% | 3% | 4% | 3% | 6% | 15% | 8% | 10% |
Balance Sheet
Consolidated Figures in Rs. Crores / View Standalone
| Mar 2012 | Mar 2013 | Mar 2014 | Mar 2015 | Mar 2016 | Mar 2017 | Mar 2018 | Mar 2019 | Mar 2020 | Mar 2021 | Mar 2022 | Mar 2023 | Sep 2023 | |
|---|---|---|---|---|---|---|---|---|---|---|---|---|---|
| Equity Capital | 4 | 4 | 4 | 4 | 4 | 4 | 4 | 4 | 10 | 10 | 10 | 10 | 10 |
| Reserves | 51 | 49 | 46 | 47 | 63 | 92 | 111 | 138 | 163 | 216 | 331 | 429 | 442 |
| 121 | 118 | 113 | 122 | 99 | 94 | 97 | 137 | 146 | 142 | 137 | 171 | 224 | |
| 29 | 44 | 55 | 47 | 39 | 41 | 47 | 53 | 59 | 70 | 139 | 128 | 133 | |
| Total Liabilities | 205 | 215 | 219 | 221 | 204 | 232 | 259 | 333 | 378 | 439 | 617 | 739 | 809 |
| 103 | 109 | 105 | 103 | 100 | 115 | 129 | 168 | 229 | 242 | 281 | 325 | 354 | |
| CWIP | 4 | 1 | 0 | 1 | 6 | 2 | 6 | 32 | 10 | 9 | 30 | 140 | 159 |
| Investments | 0 | 4 | 0 | 0 | 0 | 0 | 0 | 0 | 0 | 0 | 0 | 0 | 0 |
| 98 | 101 | 113 | 117 | 99 | 114 | 124 | 132 | 139 | 188 | 306 | 274 | 295 | |
| Total Assets | 205 | 215 | 219 | 221 | 204 | 232 | 259 | 333 | 378 | 439 | 617 | 739 | 809 |
Shareholding Pattern
Numbers in percentages
| Mar 2021 | Jun 2021 | Sep 2021 | Dec 2021 | Mar 2022 | Jun 2022 | Sep 2022 | Dec 2022 | Mar 2023 | Jun 2023 | Sep 2023 | Dec 2023 | |
|---|---|---|---|---|---|---|---|---|---|---|---|---|
| 65.00% | 65.00% | 65.00% | 65.00% | 65.00% | 65.00% | 65.01% | 65.01% | 65.10% | 65.10% | 65.10% | 65.10% | |
| 0.00% | 0.02% | 0.00% | 0.01% | 0.00% | 0.00% | 0.18% | 0.53% | 0.62% | 0.68% | 0.65% | 0.73% | |
| 9.53% | 9.21% | 8.70% | 8.55% | 8.06% | 8.04% | 8.01% | 8.15% | 8.03% | 8.28% | 8.42% | 8.69% | |
| 25.47% | 25.77% | 26.29% | 26.44% | 26.93% | 26.96% | 26.81% | 26.31% | 26.23% | 25.95% | 25.83% | 25.48% | |
| No. of Shareholders | 6,147 | 8,334 | 16,458 | 17,979 | 26,710 | 34,762 | 60,376 | 70,064 | 72,330 | 75,943 | 78,086 | 73,913 |