ABOUT :-
Ratnaveer Precision Engineering Limited (An ISO 9001 company) was established in the year 2000 in Gujarat, India. Adapting to an ever changing scenario and discovering the growing needs of the market place has allowed Ratnaveer to produce high quality products like Stainless Steel Washers, Solar Panel Hooks, Tubes and Finished Sheets and Sheet Metal Products.
Ratnaveer is catering an excellence of services and competitive prices over the years. We have extremely trained staffs to cater your needs and deliveries with precised quality products.
रत्नवीर प्रिसिजन इंजीनियरिंग लिमिटेड (एक ISO 9001 कंपनी) की स्थापना वर्ष 2000 में गुजरात, भारत में की गई थी। लगातार बदलते परिदृश्य को अपनाने और बाजार की बढ़ती जरूरतों की खोज ने रत्नवीर को स्टेनलेस स्टील वॉशर, सोलर पैनल हुक, ट्यूब और तैयार शीट और शीट मेटल उत्पाद जैसे उच्च गुणवत्ता वाले उत्पाद बनाने की अनुमति दी है।
रत्नवीर कई वर्षों से उत्कृष्ट सेवाएं और प्रतिस्पर्धी कीमतों पर सेवाएं प्रदान कर रहा है। आपकी आवश्यकताओं को पूरा करने और सटीक गुणवत्ता वाले उत्पादों के साथ डिलीवरी करने के लिए हमारे पास बेहद प्रशिक्षित कर्मचारी हैं।
- Market Cap ₹ 579 Cr.
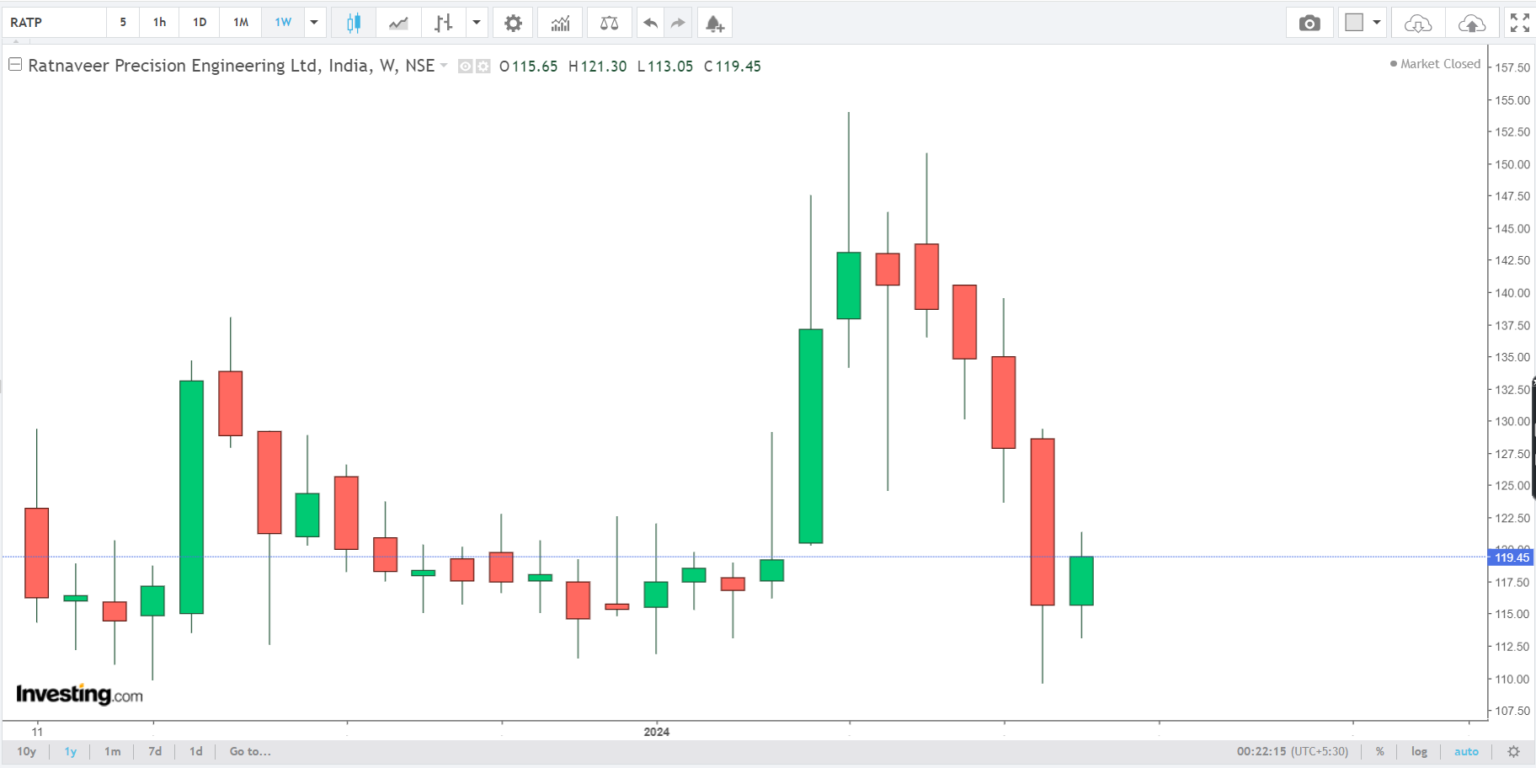
- Current Price ₹ 119
- High / Low ₹ 154 / 109
- Stock P/E 16.7
- Book Value ₹ 49.0
- Dividend Yield 0.00 %
- ROCE 14.5 %
- ROE 29.1 %
- Face Value ₹ 10.0
| Stock Price CAGR | |
|---|---|
| 10 Years: | % |
| 5 Years: | % |
| 3 Years: | % |
| 1 Year: | % |

Quarterly Results
Figures in Rs. Crores
| Jun 2022 | Sep 2022 | Dec 2022 | Mar 2023 | Jun 2023 | Sep 2023 | Dec 2023 | |
|---|---|---|---|---|---|---|---|
| 93.48 | 128.40 | 107.04 | 150.83 | 117.66 | 142.49 | 193.19 | |
| 83.62 | 115.80 | 97.88 | 136.82 | 103.04 | 129.31 | 175.49 | |
| Operating Profit | 9.86 | 12.60 | 9.16 | 14.01 | 14.62 | 13.18 | 17.70 |
| OPM % | 10.55% | 9.81% | 8.56% | 9.29% | 12.43% | 9.25% | 9.16% |
| 0.31 | 0.27 | 0.21 | 1.00 | 0.52 | 0.87 | 0.99 | |
| Interest | 2.22 | 3.59 | 3.54 | 2.94 | 3.43 | 3.24 | 3.45 |
| Depreciation | 1.20 | 0.66 | 1.10 | 1.06 | 1.03 | 1.39 | 1.83 |
| Profit before tax | 6.75 | 8.62 | 4.73 | 11.01 | 10.68 | 9.42 | 13.41 |
| Tax % | 18.52% | 19.37% | 16.07% | 16.89% | 23.03% | 15.39% | 31.02% |
| 5.50 | 6.95 | 3.98 | 9.15 | 8.21 | 7.98 | 9.26 | |
| EPS in Rs | 13.52 | 17.09 | 9.37 | 2.64 | 2.37 | 1.65 | 1.91 |
Profit & Loss
Figures in Rs. Crores
| Mar 2020 | Mar 2021 | Mar 2022 | Mar 2023 | TTM | |
|---|---|---|---|---|---|
| 297 | 360 | 427 | 480 | 604 | |
| 272 | 340 | 399 | 434 | 545 | |
| Operating Profit | 25 | 20 | 28 | 46 | 60 |
| OPM % | 8% | 6% | 6% | 10% | 10% |
| 2 | 4 | 2 | 1 | 3 | |
| Interest | 14 | 12 | 12 | 12 | 13 |
| Depreciation | 2 | 3 | 4 | 4 | 5 |
| Profit before tax | 10 | 10 | 13 | 31 | 45 |
| Tax % | 30% | 43% | 30% | 18% | |
| 7 | 5 | 9 | 25 | 35 | |
| EPS in Rs | 17.70 | 13.42 | 23.31 | 7.22 | 8.57 |
| Dividend Payout % | -0% | -0% | -0% | -0% |
Balance Sheet
Figures in Rs. Crores
| Mar 2020 | Mar 2021 | Mar 2022 | Mar 2023 | Sep 2023 | |
|---|---|---|---|---|---|
| Equity Capital | 4 | 4 | 4 | 35 | 49 |
| Reserves | 47 | 52 | 62 | 71 | 189 |
| Preference Capital | 1 | 1 | 1 | 1 | |
| 139 | 150 | 190 | 229 | 185 | |
| 53 | 50 | 53 | 54 | 43 | |
| Total Liabilities | 242 | 256 | 309 | 389 | 466 |
| 22 | 32 | 41 | 50 | 44 | |
| CWIP | 4 | 3 | 4 | 9 | 21 |
| Investments | -0 | -0 | -0 | -0 | -0 |
| 217 | 221 | 264 | 330 | 401 | |
| Total Assets | 242 | 256 | 309 | 389 | 466 |
Shareholding Pattern
Numbers in percentages
| Sep 2023 | Dec 2023 | |
|---|---|---|
| 55.48% | 55.48% | |
| 10.47% | 3.82% | |
| 0.01% | 0.01% | |
| 34.05% | 40.70% | |
| No. of Shareholders | 41,229 | 42,400 |